My Favorite Ways to Evaluate the Competition
I believe that building a business is a forever-iterative process. In fact, I don’t see how one could even be a business owner without a true love for learning. Because my gosh, things are always changing. There’s so much information to take in, all. the. time. One of my former bosses used to preach: test, learn, and refine. This is a meta-practice that can be applied anywhere in the business, and one great place to start is when we evaluate the competition.
So understanding what it is that your business offers, intuiting what your clients desire, and having a consistent process to evaluate the competition, is a task that’s never complete. It’s a cycle that you’ll have to consider and refresh during every year of your business’s lifetime.

When it comes to looking at the competition, I am a fan of “keeping your eyes on your own yoga mat” and not watching the advanced yogis’ fancy handstands. (Sorry if the yoga metaphor is lost on you, but I’m sure that you get the gist). Instead, I prefer that one concentrates on their own business and clients.
However, I do think it’s important to have a sense of what your competition is doing and risks that this can create for your work. But this is an important distinction, as the point isn’t to copy them. The point is to know what they’re doing so that you can see the opportunity and approach it differently.
I have two simple models that are my go-to’s, to evaluate the competition. The key here is that each assumes that you understand what clients want. We’re not trying to force a product or service on clients; we are always approaching from the angle, “how can we fill a need?” (Whether the client can articulate his/her need as such is another question).
1. Value Curve
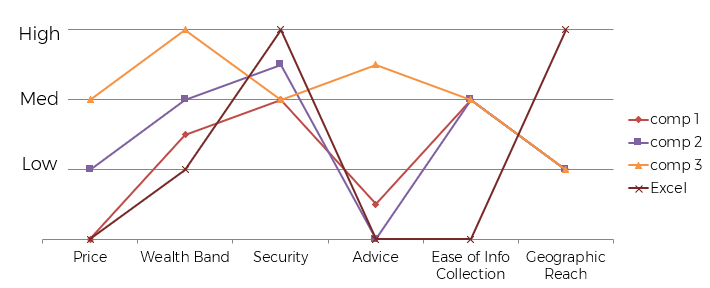
The goal of the value curve is to consider: what are the value points – or product attributes – that my clients most care about, and how does the competition perform for each?
Value Curve for Fintech Aggregators

The above chart is one that I created for my business plan for a FinTech company a few years ago. The x-axis holds attributes like price, target market, security levels, amount of advice, ease of use, and where the software is available. Then, the y-axis rates the delivery of each attribute by competitor (publicly, I’ll just call them 1, 2, and 3).
If you’re curious about the so-what, here was the surprising conclusion from the above: for an international citizen with varied financial assets (my target market), Excel was the only option that came close to delivering what clients needed.
2. Competitive Positioning Map
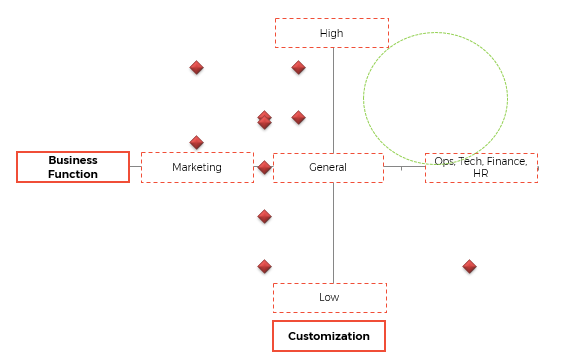
This one is great for understanding what everyone else is up to and where there’s a hole in the market – space for you to do something different.
I once had a professor, who said to think of this like a military positioning map. The worst place to be is the middle, for you’re susceptible to being attacked from all sides. And from the client’s vantage, you’re average.

The example above is a live one for Ellevated Outcomes. In the business consulting / coaching arena, there are, of course, many business functions on which a company can focus (these are on the x-axis).
On the y-axis I plotted a characteristic that I heard loud and clear during market research interviews: the people I spoke to didn’t want to be flooded with more and more generic information. They wanted someone to look at their specific business and diagnose, “here’s what will be best for you.” They wanted customized advice.
So I looked at these two areas and plotted ten competitors (the red diamonds). Then I found the gap: there weren’t many competitors who were able to flex their expertise – from marketing to finance, ops, HR – and zoom out to see the whole business picture. And they definitely weren’t doing it in a bespoke manner for clients. (I get it! It’s expensive and it’s hard work)!
But therein, Ellevated Outcomes found our opening…
Next Steps:
1. List the 5-12 key competing factors in your industry. Note: these must be from the vantage of clients. So for example, the price that a client perceives is a characteristic, but your internal costs are not.
Choose 3-5 competitors or colleagues. For yourself and each of the competitors, rank how you all perform on each factor: low, medium, or high.
Map these on your value curve.
Then, reflect and brainstorm: “For which characteristic(s) is our value low? What can we do to increase it?”
2. Make a list of your product or service “categories” – how a client would categorize each competitor.
Then, draw on conclusions that you took from your market opportunity interviews. What is the attribute that you heard over and over again that your people want? For us, it was customization. This told me: if we design the products to be customized, the demand will be greater. Your y-axis will chart a characteristic that denotes demand for your offer.
Draw conclusions to these three questions:
1) What category are we in (or entering)?
2) What is the specific value that we are offering, relative to alternatives out there?
3) How can we connect with our clients needs, then place our offer in their minds?
That last question is the key and where we’ll move to with our next installment of Building Your Business Plan…


